Recruitment Metrics for Agencies That Explain Where Searches Stall
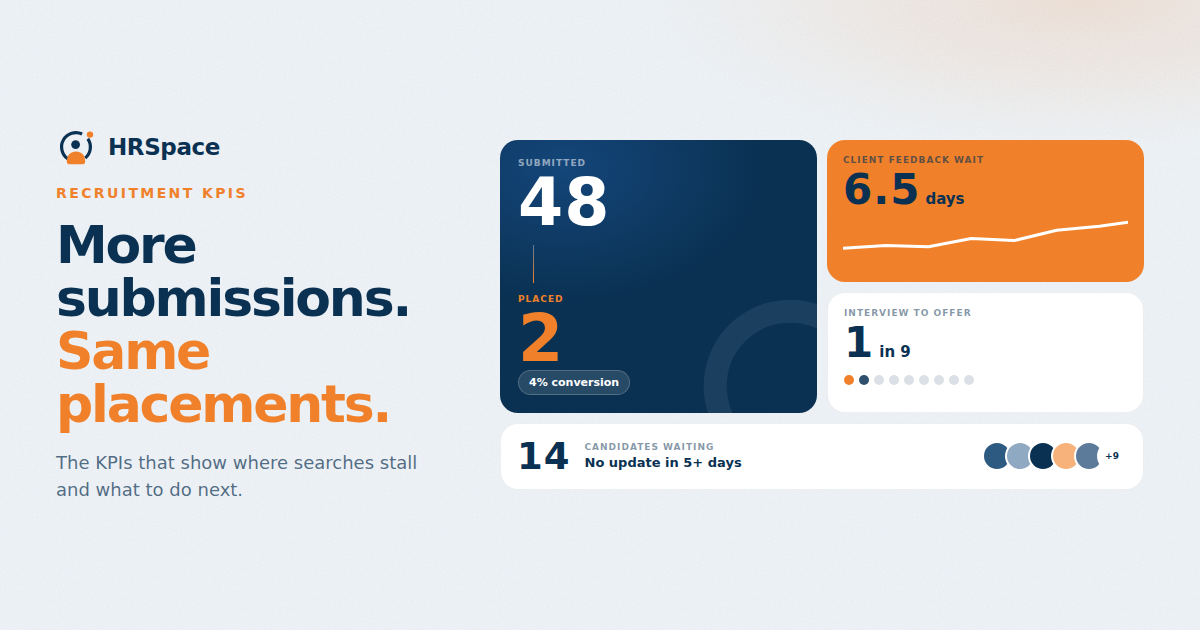
The weekly report says submissions are up. Your consultants have been busy, but several searches still feel stuck. Candidates are asking for updates, clients have not returned feedback, and the extra activity has not yet produced more placements.
That is a good moment to look beyond the headline count. Recruitment metrics should help you understand where work is slowing down and which conversation needs to happen next. A small agency can begin with a few measures that everyone interprets in the same way.
Start with the questions already coming up in your search reviews. Are profiles reaching the right decision maker? Do interviews lead to offers? Is one client taking much longer to respond? Choose measures that help answer those questions and keep the underlying cases easy to find.
Define events before calculating rates
Agencies often use familiar labels differently. Submitted might mean a profile is prepared, sent, or acknowledged by the client. Placed might mean an offer is accepted, a contract is signed, or the candidate has started.
Ask two consultants what placed means. One may say the offer was accepted; the other may wait until the candidate starts. Both events matter. Give them separate names in the report so you know which one you are discussing.
Also decide the unit. An application to a particular vacancy is different from a unique candidate. One person submitted to two roles represents two application events. If you count that person once in the numerator and twice in the denominator, the resulting rate becomes misleading.
Use a small set of diagnostic measures
The following recruitment KPIs use suggested definitions. Adapt them to the agency's process and keep the definitions consistent over time.
|
Measure |
Suggested calculation |
What to investigate |
|
Submission to interview rate |
Submitted applications invited to interview divided by submitted applications in the chosen group |
Brief alignment and submission quality |
|
Interview to offer rate |
Interviewed applications receiving an offer divided by interviewed applications in the chosen group |
Assessment findings and role expectations |
|
Offer acceptance rate |
Accepted offers divided by offers with a recorded decision |
Terms, timing, and candidate expectations |
|
Client feedback delay |
Elapsed time from submission to first actionable client response |
Decision ownership and feedback capacity |
|
Overdue candidate updates |
Active applications whose promised update date has passed |
Communication ownership and pending decisions |
Multiply the rate calculations by 100 if you want percentages. Use only records that belong to the same defined group, and explain how undecided applications are handled.
Compare candidates who entered at the same point
A report that divides this month's interviews by this month's submissions may mix unrelated applications. Some interviews could come from profiles submitted last month, while recent submissions have not yet had time to progress.
For conversion analysis, group applications by a defined starting event, such as submissions made during a particular month. Follow that group until the decision window is sufficiently complete, and show unresolved cases separately.
Operational reports answer a different question. Interviews scheduled this week can help plan workload even when those applications were submitted earlier. Keep that activity view separate from a conversion claim.
A hypothetical conversion example
Suppose an agency submitted 20 applications for a set of comparable roles. Eight later received interview invitations, seven were declined, and five were still awaiting a decision at the review date.
Using all 20 submitted applications, the observed submission to interview rate is 40 percent at that date. It is not necessarily the final rate because five outcomes remain unresolved.
Show the pending count beside the result. If you instead calculate a rate using only decided applications, label that denominator clearly. Both views can support a discussion, but switching between them without explanation can make performance appear to improve or worsen artificially.
These numbers illustrate the calculation. They are not an industry benchmark or an expected agency result.
Look at delays alongside conversions
A search can have a strong interview rate and still lose candidates because feedback arrives late. Measure the elapsed time between a submission and an actionable response, then examine the cases behind the result.
If one client took a month to respond, the average may not describe the rest of the searches very well. The median can offer another view of a typical delay. Keep the count and oldest unresolved cases beside it, though. A tidy average does not help the candidate who is still waiting for an answer.
Distinguish intentional pauses from missed commitments. A vacancy frozen by the client should not be treated as the same operational problem as feedback that was promised and forgotten. Record the pause so the team can explain the difference.
Review by search type before comparing consultants
An executive assignment and a high-volume operational search involve different candidate pools, decision cycles, and workloads. Comparing them using one target can reward the consultant with easier assignments rather than better execution.
Group comparable work where the volume allows, and discuss context where it does not. A consultant's low conversion rate might reflect an outdated brief, limited compensation, or inconsistent client feedback. It might also reveal weak screening. The metric should start that investigation.
Avoid turning activity volume into the only performance measure. If consultants are rewarded primarily for submissions, they may feel pressure to send profiles before the fit is clear.
Connect every review to an action
Use the report to decide what to do. A growing feedback delay may call for a conversation with the client about decision ownership. Repeated interview rejections for the same missing requirement may call for a better intake question. Give the action an owner, then return to the relevant searches at the next review.
Keep a record of the change and review the relevant cases later. Do not assume that a better number proves your intervention caused the improvement. Search conditions may have changed too.
For independent recruiters, this can be a brief monthly review rather than a formal dashboard meeting. The purpose is to find recurring friction that you can reasonably address.
Check reporting with records you understand
Before relying on an ATS dashboard, use a small set of invented or anonymized applications and calculate the expected result manually. Include a withdrawal, a paused role, and a candidate with two applications.
In an HRSpace Recruitment demo, ask how the reports you need would be produced and which events they use. Confirm agency-specific reporting, exports, and calculation definitions directly. A polished chart is useful only when you understand the records behind it.
Common mistakes
Comparing incomplete cohorts, hiding small sample sizes, and borrowing generic benchmarks can make a report look more certain than the evidence supports.
Another common problem is changing stage definitions without updating the reporting notes. If submitted starts to mean something different halfway through the year, annotate that change before comparing periods.
FAQ
Which recruitment metrics should a small agency track first
Begin with submission to interview conversion, client feedback delay, offer outcomes, and overdue candidate commitments. Add measures when they answer a recurring operational question.
How should an agency define time to fill
State the starting event and ending event explicitly, such as confirmed brief to accepted offer. Use a separate measure if you need the time to the candidate's actual start date.
Are recruitment benchmarks useful
They can provide context when the population and definitions are comparable. Your own consistently measured searches are often a more useful starting point for investigating changes.
What if there are too few placements for a meaningful rate
Show the counts and review the individual cases. A percentage based on a handful of outcomes should not be treated as a stable performance pattern.
Start with a report you can explain
Choose one recurring problem and one measure that helps you examine it. Take five applications and check the dates and outcomes yourself. If you cannot explain how the report treats those cases, resolve the definition before using the number to assess a consultant or a client.
Ready to make HR the easy part?
Explore modular pricing and start a free 14-day trial.